We’re glad to announce the updates which have been released on October 25, 2017, as well as some feature requests and new improvements rolled out throughout the App. Please find out what’s new here for you in this Mobile updates:
Android
- Access account information Offline
- Performance Dashboard for Overall Sales Performance
- Pipeline by Stage lists the Deals
- Win Analysis
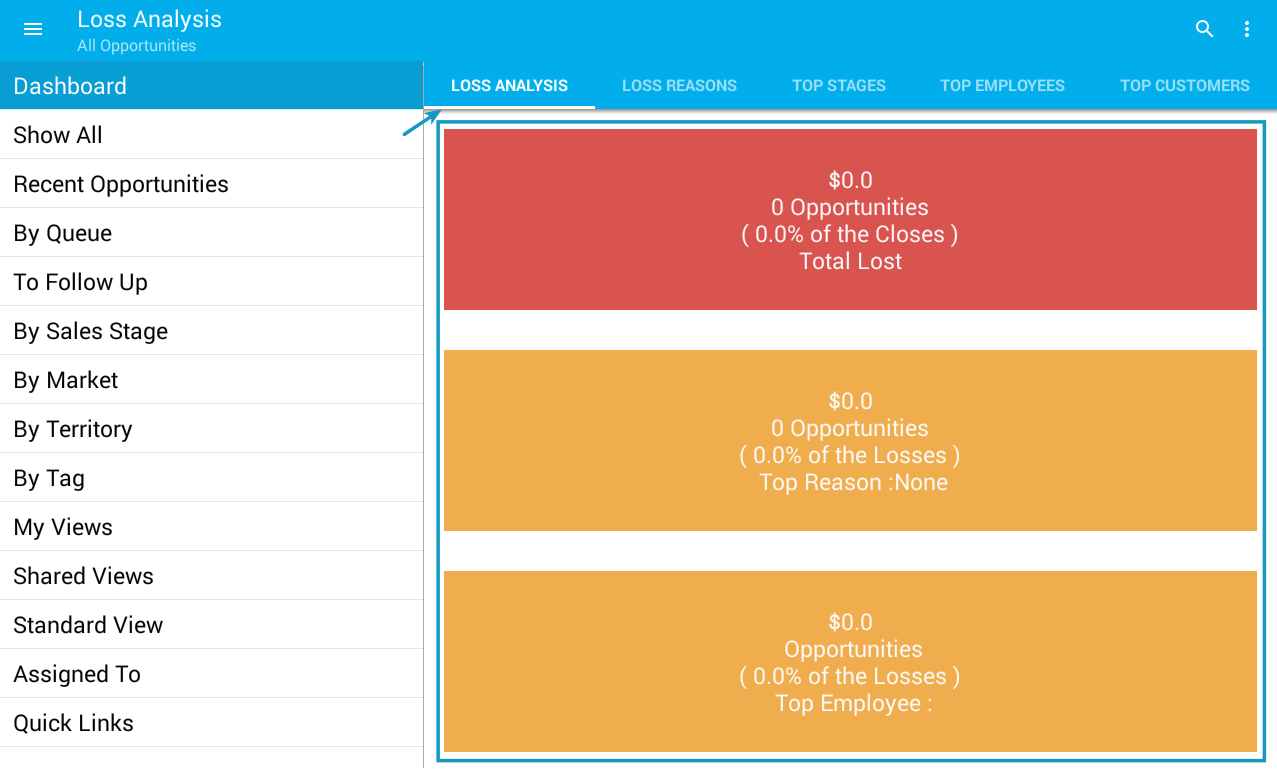
- Loss Analysis
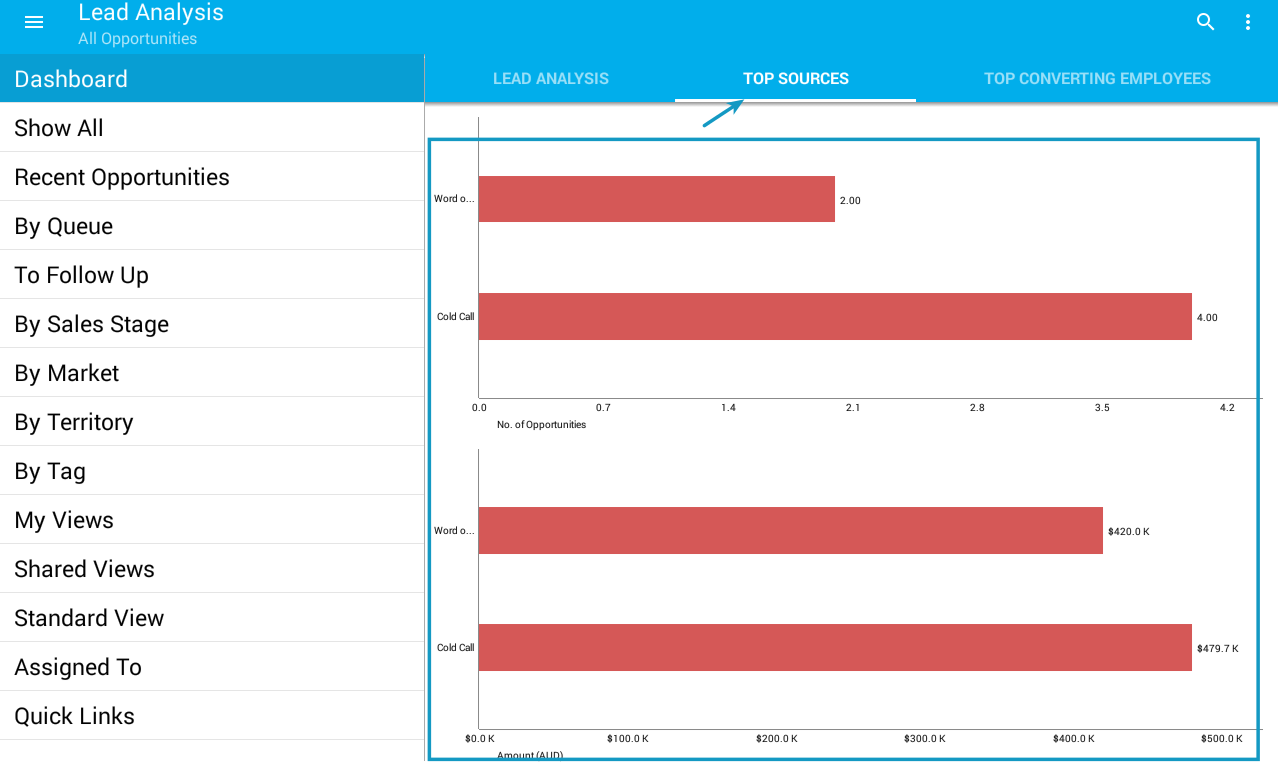
- Lead Analysis
Let us discuss briefly about the new deployment which were brought to live.
Android Updates
CRM
- Access account information Offline – In this release, we have come up with pretty just starting out features that have been requested by most of our valuable customers, that is, “Offline Access”. You can now access your Account information in offline without any hassle. For now, you are able to access your list page and also view every information in your account.
Opportunities
- Performance Dashboard for Overall Sales Performance – We have enhanced our “Performance Dashboard” in Opportunities App. It has some interesting options to check your performance from the different scenarios such as
- All Opportunities Performance
- My Opportunities Performance
- My Team’s Opportunities Performance
- My Employee Performance
It has a graphical representation of our sales performance analysis. Through that, you will be able to find out the performance of the team and also able to check your sales activities which are attained by yourself as “My Performance” and “My Employee Performance”.
For Instance: Let’s take a look at “My Team’s Opportunities Performance”. this will let you know your team’s performance as how much they attain and their projections in the form of graphical representation as a “Meter Gauge chart”. It provides you the exact amount and the percentage of your Projection and Attainment. Beneath that graphical representation, you will find the exact amount and percentage of “Pipeline”, “Forecast”, “Attainment” and “Cushion”. If you would like to get the details of Opportunities, just click on Pipeline” or “Forecast” or “Attainment” or “Cushion”. Just tapping will redirect you to Opportunities.
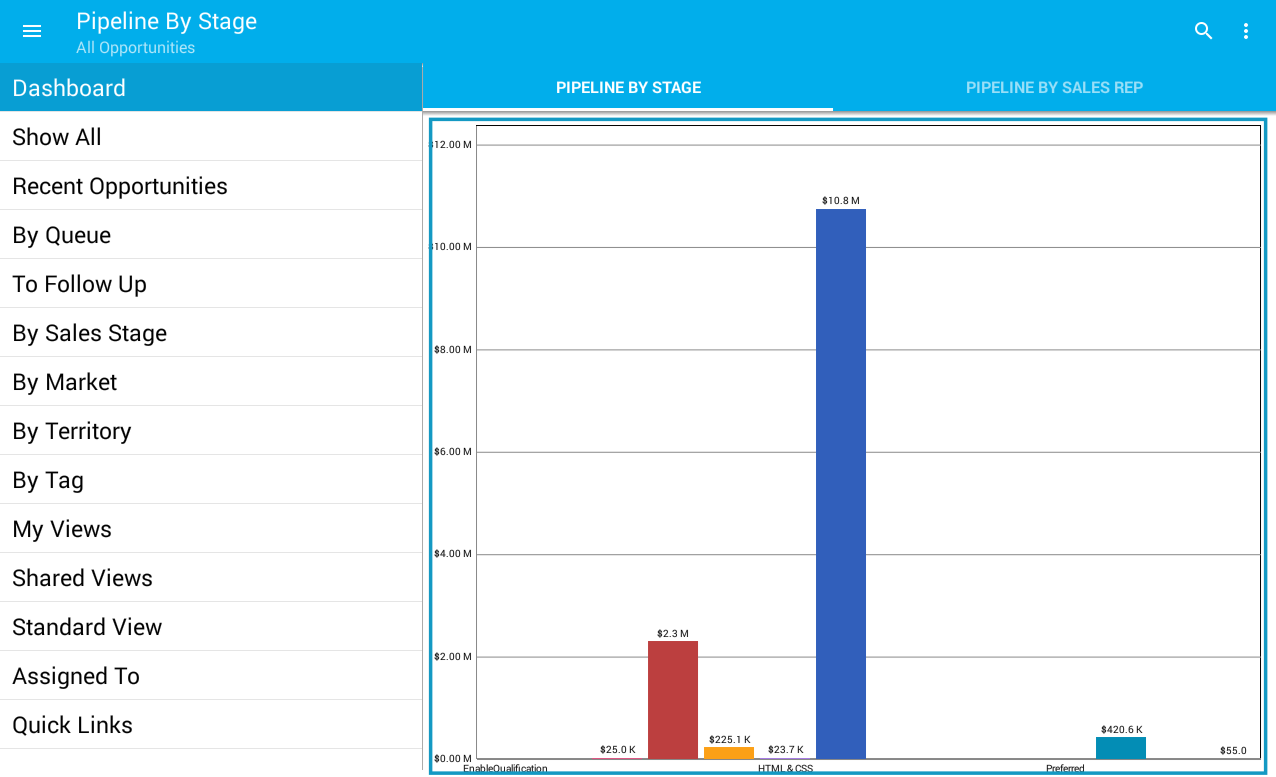
- Pipeline by Stage lists the Deals – We have implemented the “Pipeline By Stage” Dashboard in Opportunities App. This will show you the visual report of “Pipeline by Stage” and “Pipeline by Sales Rep”.
- Pipeline by Stage – It helps to let you know the deals based on the stages and you are allowed to gather the values which are associated with the deals. Just click on any of the stages and it will redirect you to the Opportunities that are created using the sale stage which you have chosen.
For Instance: If you would like to view all the Opportunities in the sales stage of Prospecting – You have to click on the “Prospecting” stage from the visual report. This will show you a complete list of Opportunities which are created with the “Prospecting” stage. - Pipeline by Sales Rep – Through this, you are able to track the deals of your sales rep. Here, you can find out the sale rep, just tapping any of your sales rep. You will be taken to the Opportunities of that particular sales rep.
For Instance: If you would like to get a deeper instinct of “Katie Dustin”. Click on Sales Rep “Katie Dustin” from the Horizontal bar chart. It will give you a list of Opportunities that Katie Dustin have been doing so far.
- Pipeline by Stage – It helps to let you know the deals based on the stages and you are allowed to gather the values which are associated with the deals. Just click on any of the stages and it will redirect you to the Opportunities that are created using the sale stage which you have chosen.
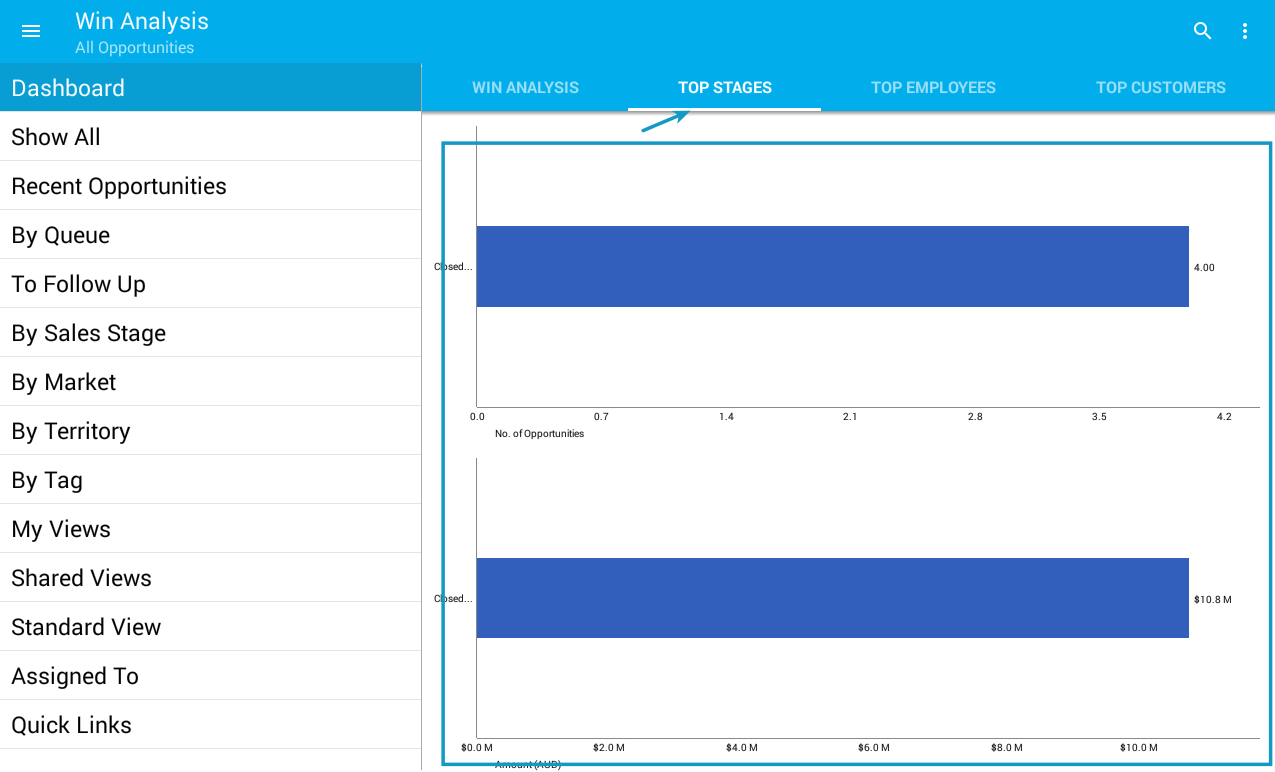
- Win Analysis – You can now get the advanced analytics for the “Win Analysis”. We’ve implemented that dashboard in the row of Opportunities Dashboard. It contains a different type of analysis report like “Win Analysis”, “Top Stages”, “Top Employees” and “Top Customers”.
From “Win Analysis”, the details of the opportunities that are under Total Won with that Amount, how many opportunities have won and the percentage of their wins will be displayed.
Through “Top Stages”, you can track the Opportunities which are in closed deal. It has two different Horizontal bar charts, one chart for Sales Stages with Opportunities Count and Sales Stages with Potential.
From “Top Employees”, this view can assist you to track the accomplishments of your employees who furnished to convert sales. This Horizontal bar chart be like the Employees with Opportunities Count and Employees with the Potential.
From “Top Customers”, you can find out the customers who will give you top conversion.
Note: Just click on reports which is available in Drill down Bar and Horizontal Bar chart. It will redirects you to that associated object in Win Analysis.
If you have any queries or any suggestions you’d like to share us, about the mobile app or something new, We’d love to hear from your end!
Latest Blogs
Role Of CRM In Travel And Tourism Industry
Travel and tourism have been a significant part of everyone’s life since the ancient period. When we skim through the pages of history, It should be noted that humans were initially nomads before they became settled in one place. They...
Read more →
WHAT IS CRM TECHNOLOGY?
Introduction CRM is a technology that helps manage the entire customer information and interactions in order to build and maintain superior customer relationships. The CRM solution replaces spreadsheets and other different applications, which makes it easy for the businesses to...
Read more →
Everything you need to know about the Annual Maintenance Contract!
1. What is an Annual Maintenance Contract? 2. Benefits of Maintenance Contracts 3. How can Apptivo CRM help you manage maintenance agreements and vendors? 4. Summary Think about getting the confidence that the machinery is well-maintained and performing optimally, without...
Read more →
